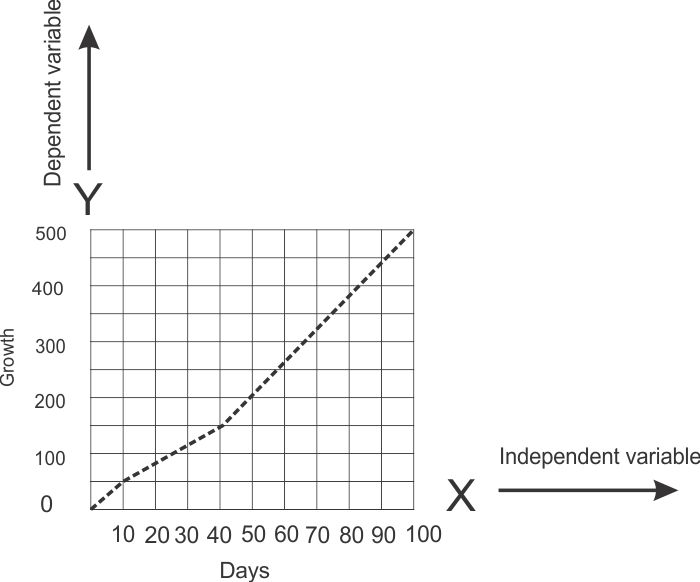
11. Which Axis (“X” horizontal or “Y” vertical) is the variable data plotted on?
The independent variable always goes on the horizontal axis (X) and the dependent variable always goes on the vertical axis (Y). For example if the graph below represented the size of an organism (100g, 200g, 300g,400g,500g) and the passing of days (10 -100 days). the days (independent variable) would go on the horizontal axis and and growth (dependent variable) would be plotted on the vertical axis.

![]()
