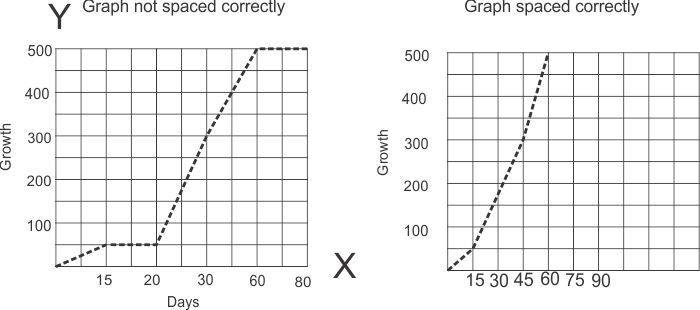
19. The values for the X axis are 15, 20, 30, and 60; should they be plotted at equal intervals?
No. Note the first graph the numbers are plotted at equal intervals, the second graph the numbers are properly spaced at equal intervals. You would misinterpret the first plot and get the best comparison on the second plot.

![]()
